Modern businesses generate large amounts of data every day: invoices, expenses, payments, advertising metrics, team working hours, and operational metrics. However, having the numbers alone does not protect a company from cash flow gaps or guarantee profit growth.
A company gains real value only when this data helps answer practical questions: Which services have the highest margins? Where do hidden cost overruns occur? Which invoices remain unpaid? Will there be enough funds to cover next month’s obligations?
30 Aug, 2026
Business Analytics: From Chaos to Informed Decisions

Mykhailo Zaliznyi
Developer at Autirra
The Illusion of Control: Having the Numbers but Not the Answers
Imagine a company whose revenue has increased by 15% in a month. At first glance, this appears to be a positive result.
However, if operating expenses have increased by 25% over the same period, the margins of key services have declined, and some issued invoices remain unpaid, the overall financial picture looks very different.
Individual metrics often lack enough context to support accurate conclusions. High revenue does not mean that free cash is available, and a fully utilized team does not guarantee strong profitability. To understand the true state of a business, it is important to analyze not isolated numbers, but the relationships between them.
How Analytics Turns Data into Decisions
In its day-to-day operations, a company issues invoices, makes purchases, pays for services, tracks team working hours, and generates other operational data.
An analytics system structures this information and uses it to calculate management metrics: revenue and expense trends, actual margins, the status of unpaid invoices, upcoming payments, and cash flow forecasts.
As a result, managers receive not a set of disconnected numbers, but a clear basis for action. This makes it possible to adjust budgets, control expenses, plan payments, and respond to financial risks in time.
From Disconnected Systems to a Unified Picture
In most companies, financial and operational information is stored in different places. Invoices may be kept in accounting software, expenses in spreadsheets, payments in banking or accounting services, and other metrics in internal applications or databases.
Each system shows only one part of the business. To obtain a complete picture, employees have to transfer data manually, reconcile spreadsheets, and compile reports from multiple sources.
A unified dashboard solves this problem by bringing financial and operational metrics together in one place.
Each system shows only one part of the business. To obtain a complete picture, employees have to transfer data manually, reconcile spreadsheets, and compile reports from multiple sources.
A unified dashboard solves this problem by bringing financial and operational metrics together in one place.
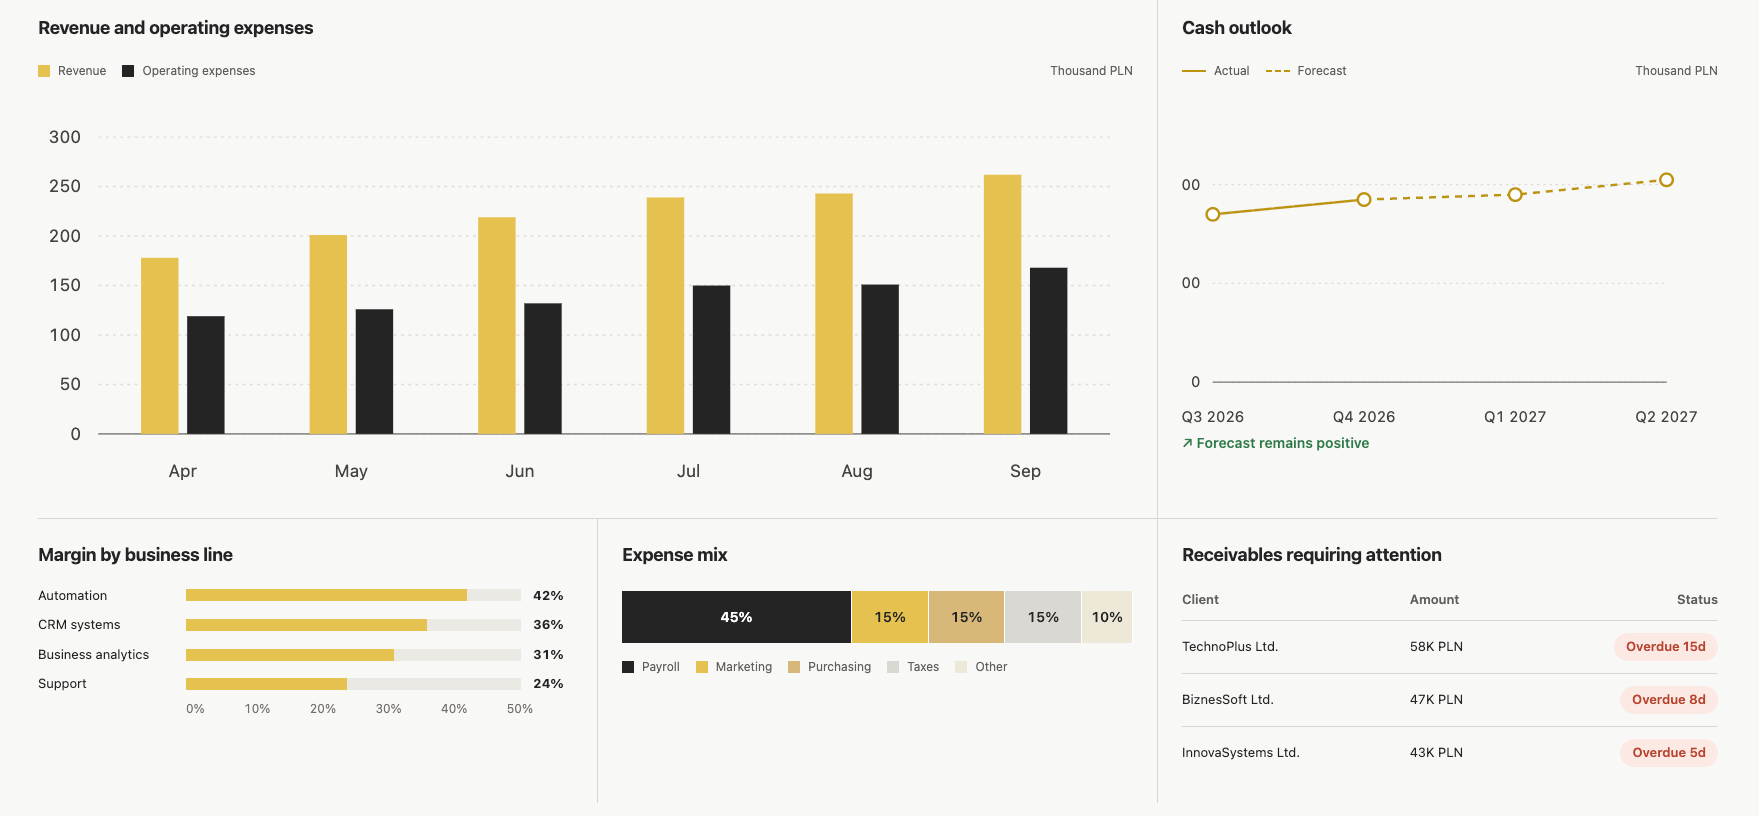
Once the data sources are synchronized, managers no longer see isolated fragments but the overall state of the business: actual revenue, expenses, unpaid invoices, upcoming payments, margins, and other key metrics.
At that point, analytics stops being a collection of separate reports and becomes a single source of reliable management information.
At that point, analytics stops being a collection of separate reports and becomes a single source of reliable management information.
Spotting Cash Flow Gaps Before They Become a Problem
One of the most important tasks of analytics is to show not only how much a company has earned, but also when that money will actually be available.
A company may issue enough invoices for the month to look profitable on paper. However, if a major client postpones payment until the following month while salaries, taxes, and supplier payments are due soon, the company may face a cash flow gap.
When the system works with up-to-date data, it can match issued invoices with payments received, account for planned expenses, and produce a cash flow forecast for the coming quarters.
This allows management to assess in advance whether enough cash will be available for future obligations and, if necessary, adjust expenses or payment schedules.
Actual Margins Instead of Rough Estimates
Another common problem is evaluating profitability based only on revenue.
A service may appear profitable while the company compares the invoiced amount only with direct costs. Once actual team hours, internal coordination, additional revisions, and other indirect costs are included, the real margin may be significantly lower.
When this data is combined in an analytics system, the company can see not only total revenue but also the actual financial performance of individual services or business areas.
This helps management review pricing, commercial terms, and cost structures in time, and direct resources toward the areas that genuinely generate profit.
Analytics That Helps the Business Stay Ahead
The value of analytics is especially clear when the system helps teams identify risks early and respond in time.
If an issued invoice is not paid on time, a system with configured integrations can automatically flag the overdue invoice and create a reminder for the responsible employee. If a particular expense category approaches its defined limit, a manager can receive a warning. If future obligations exceed expected inflows, the system can provide an early warning about a potential cash flow gap.
In this way, business analytics moves beyond passive reporting and becomes a day-to-day management tool. It helps companies not only record what has already happened but also act before potential problems occur.
Analytics as a Foundation for Business Management
Business analytics is more than charts and reports. It turns everyday operational data into a clear financial picture, enabling management to identify risks early, control expenses, and make decisions based on facts.
Ready to replace disconnected reports and spreadsheets with a unified analytics system?
Schedule a technical consultation with our team. Together, we will identify which business process to start with and prepare a step-by-step implementation plan.


Company Number: 9542845879 | VAT-5UE: PL9542845879 | Registered: Poland, Katowice 40-507 Francuska Str. 92a
© 2026 Autirra. By using our service, you accept our terms and conditions.